How EO expertise powers agri-monitoring decisions
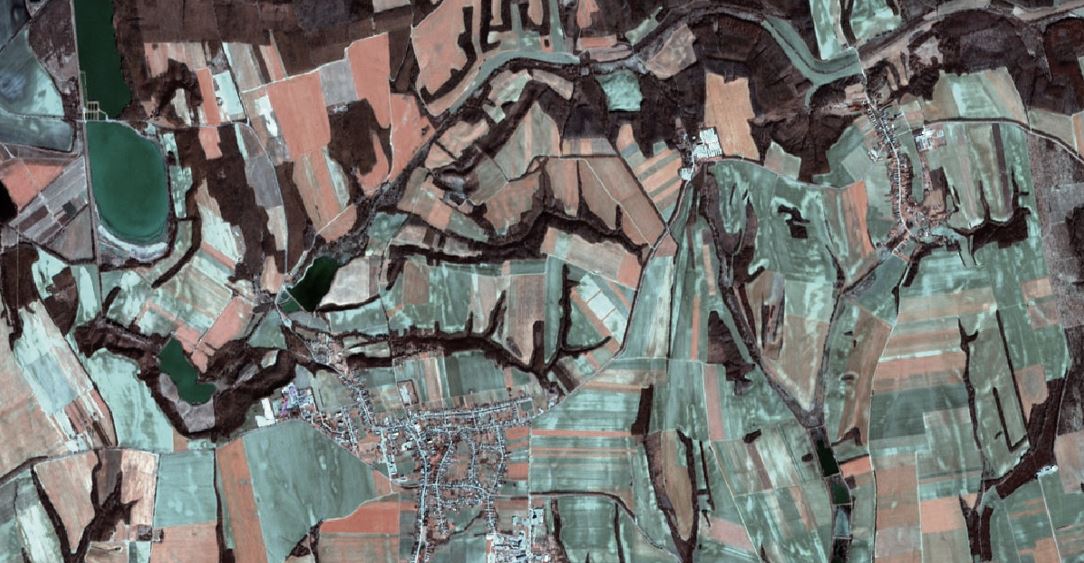
The EO-WIDGET project aimed at developing a robust technological chain linking EO data processed in cloud environments to a web interface that delivers the data and the result towards the end-users. Agri service platform integrates mini-applications providing visualization access to monitoring products and related quality assessments, while at the same time supporting expert judgment, and user activities in GIS environment. One of the key point is that the end-user platform presents real-time processed EO signals, while the back end processing can be distributed among several cloud locations and processing chains.
Parcel Explorer
Main Interface
On the initial application visit, the user is greeted with a dashboard-like interface consisting of multiple interactive elements: Welcome to the Parcel Explorer! The Parcel Explorer is the main tool for visually inspecting compliance (or non-compliance) of various parameters and markers in the scope of CbM.
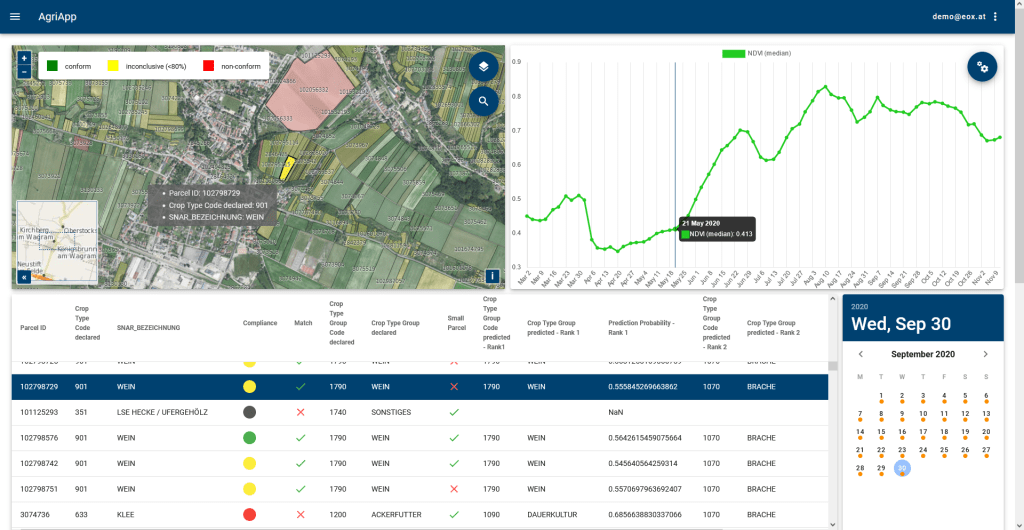
Parcel Map
The heart of the Parcel Explorer is the map element, which allows the user to browse and visually inspect agricultural parcel data, glimpse into parcel metadata (mouseover on a single parcel), switch between data product visualizations (e.g. Crop Type Conformance and Declared Groups), show/hide map layers, and draw reference areas (enabling a comparison of statistical parameters of a selected parcel and the average value of the same crop in its user defined surroundings and further similar functionalities). An overview map helps to analyse the bigger picture.
Quality Assessment Tool
Besides the parcel explorer, the application also includes some data-science-driven app views. These provide an overview over all algorithm results that are applicable for each use-case. Where prepared by the paying agency, also compliance rules for the whole territory are evaluated.
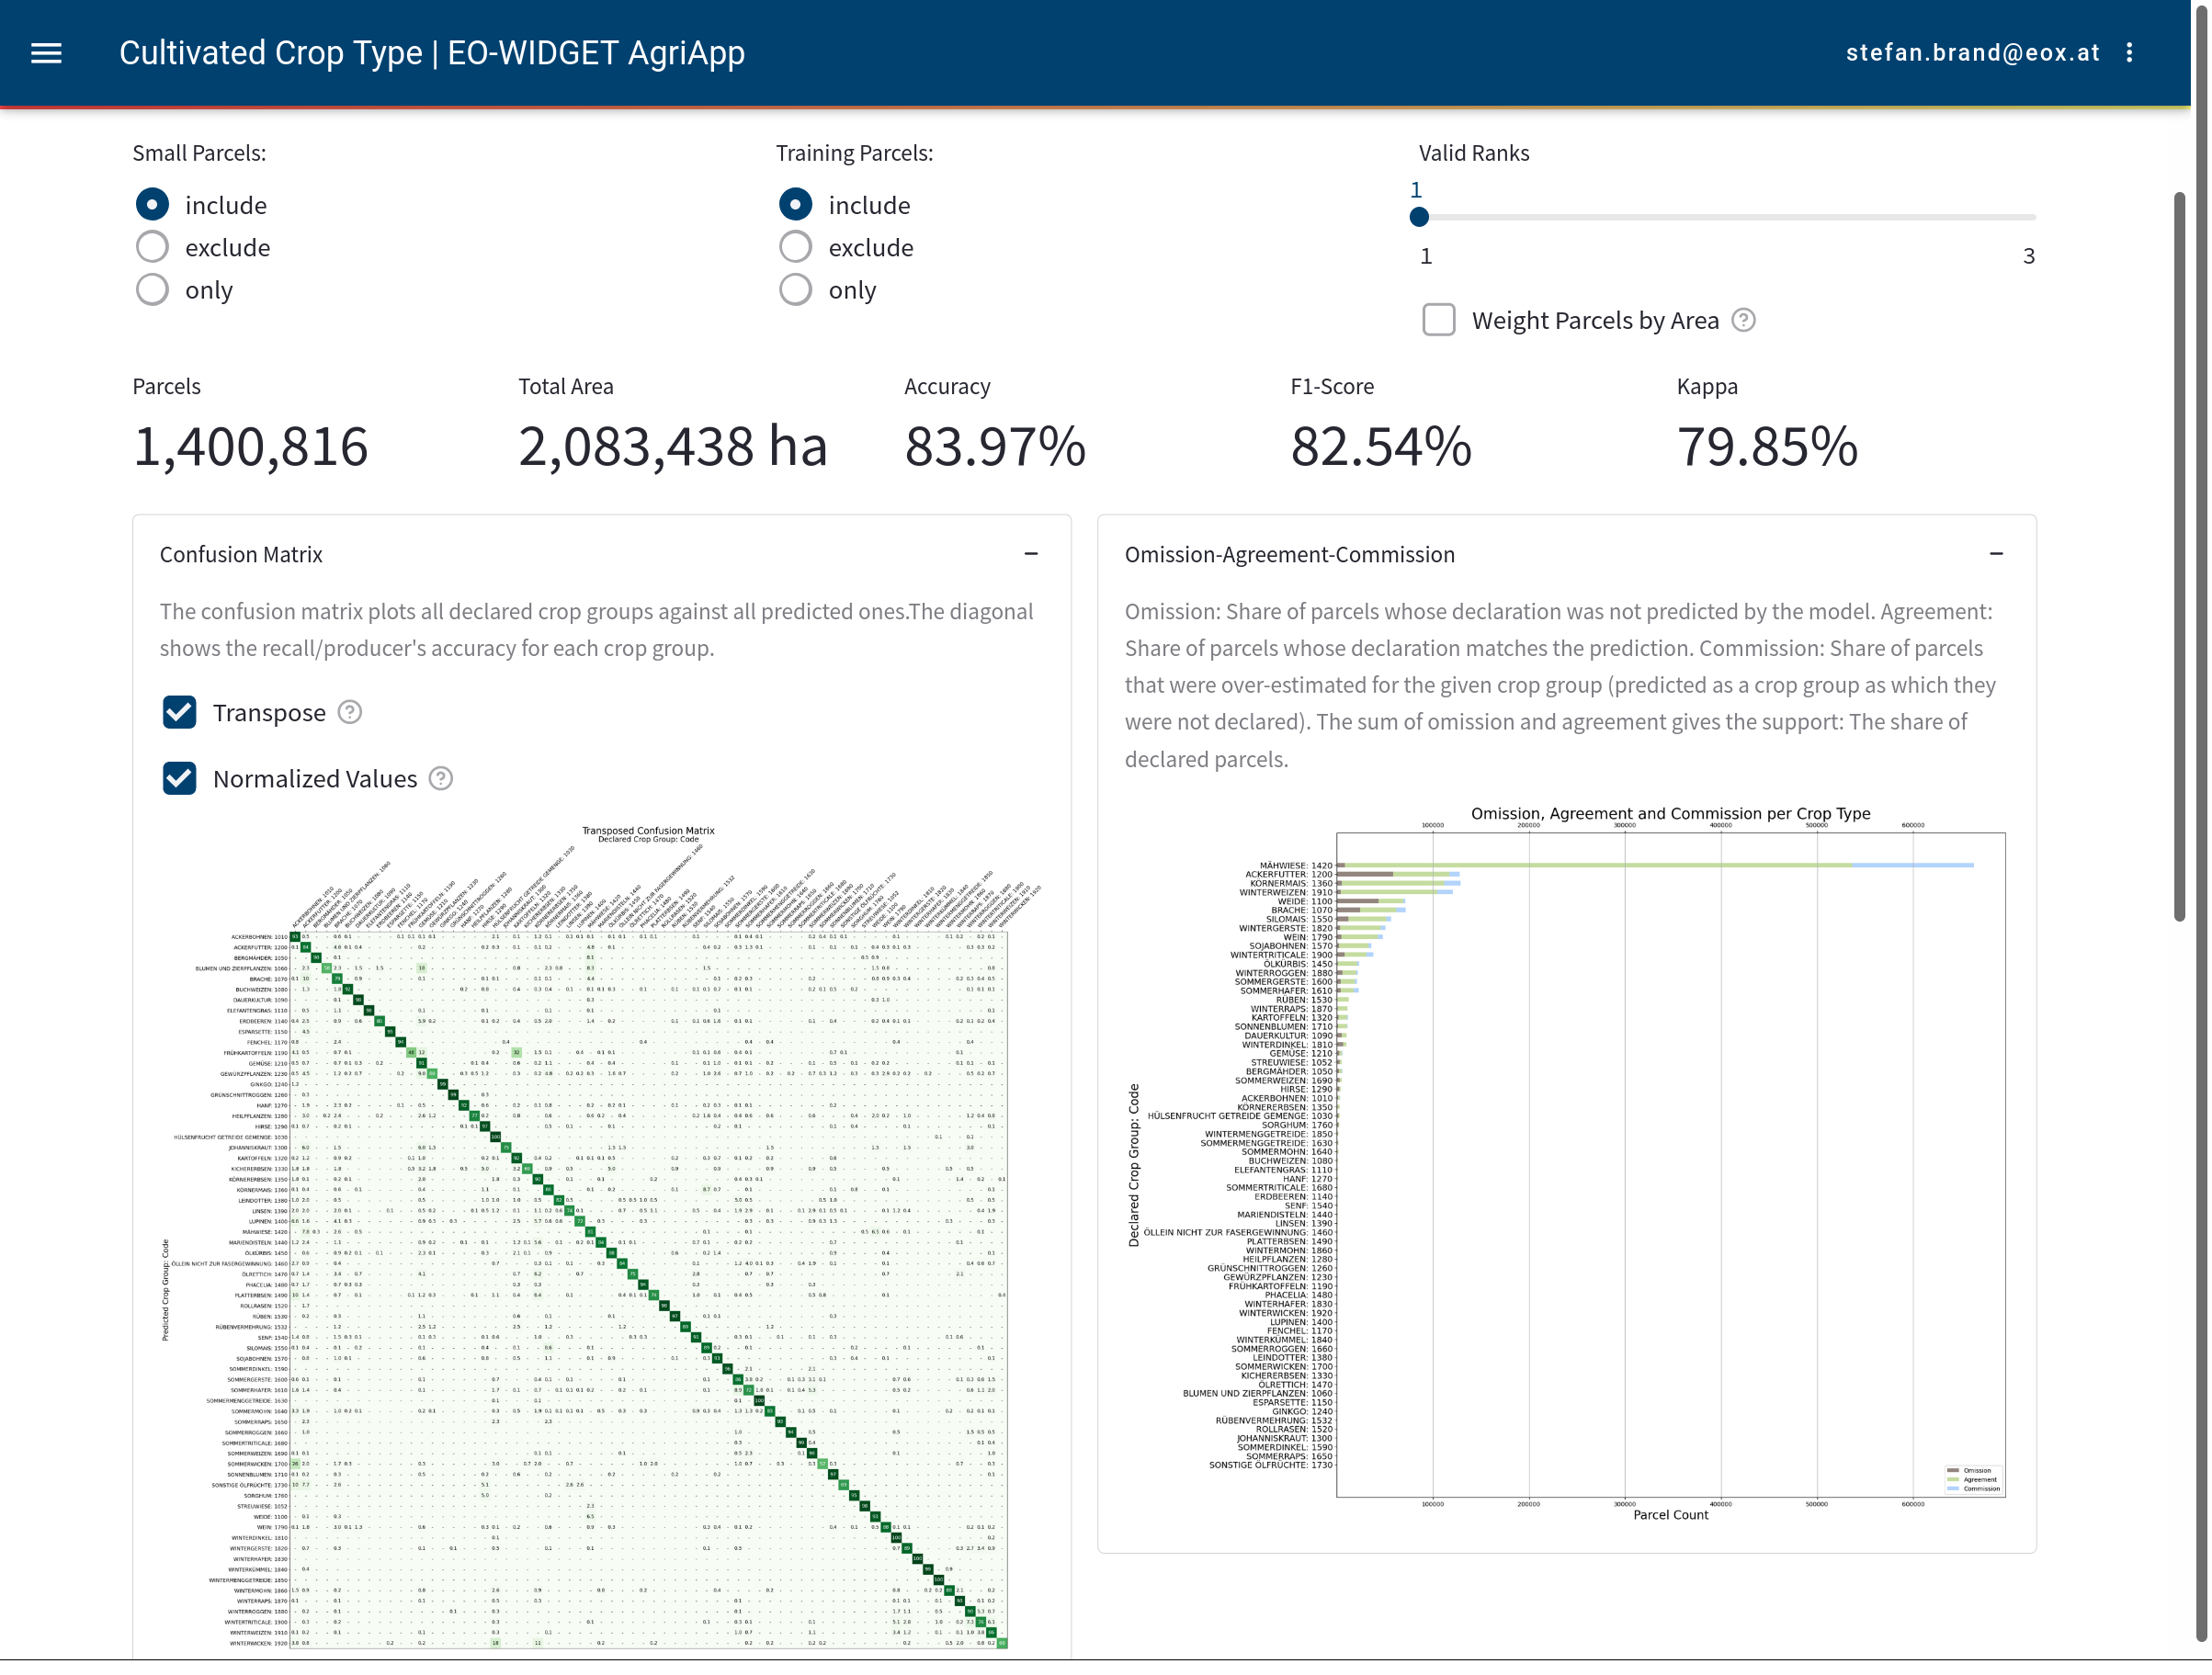
n the context of crop type classification a confusion matrix, an omission/commission chart and an f1-score chart is displayed. All of these are configurable inside the app. Settings like the exclusion of small parcels and training parcels, and if the results are weighted by parcel area, are defined by the user.
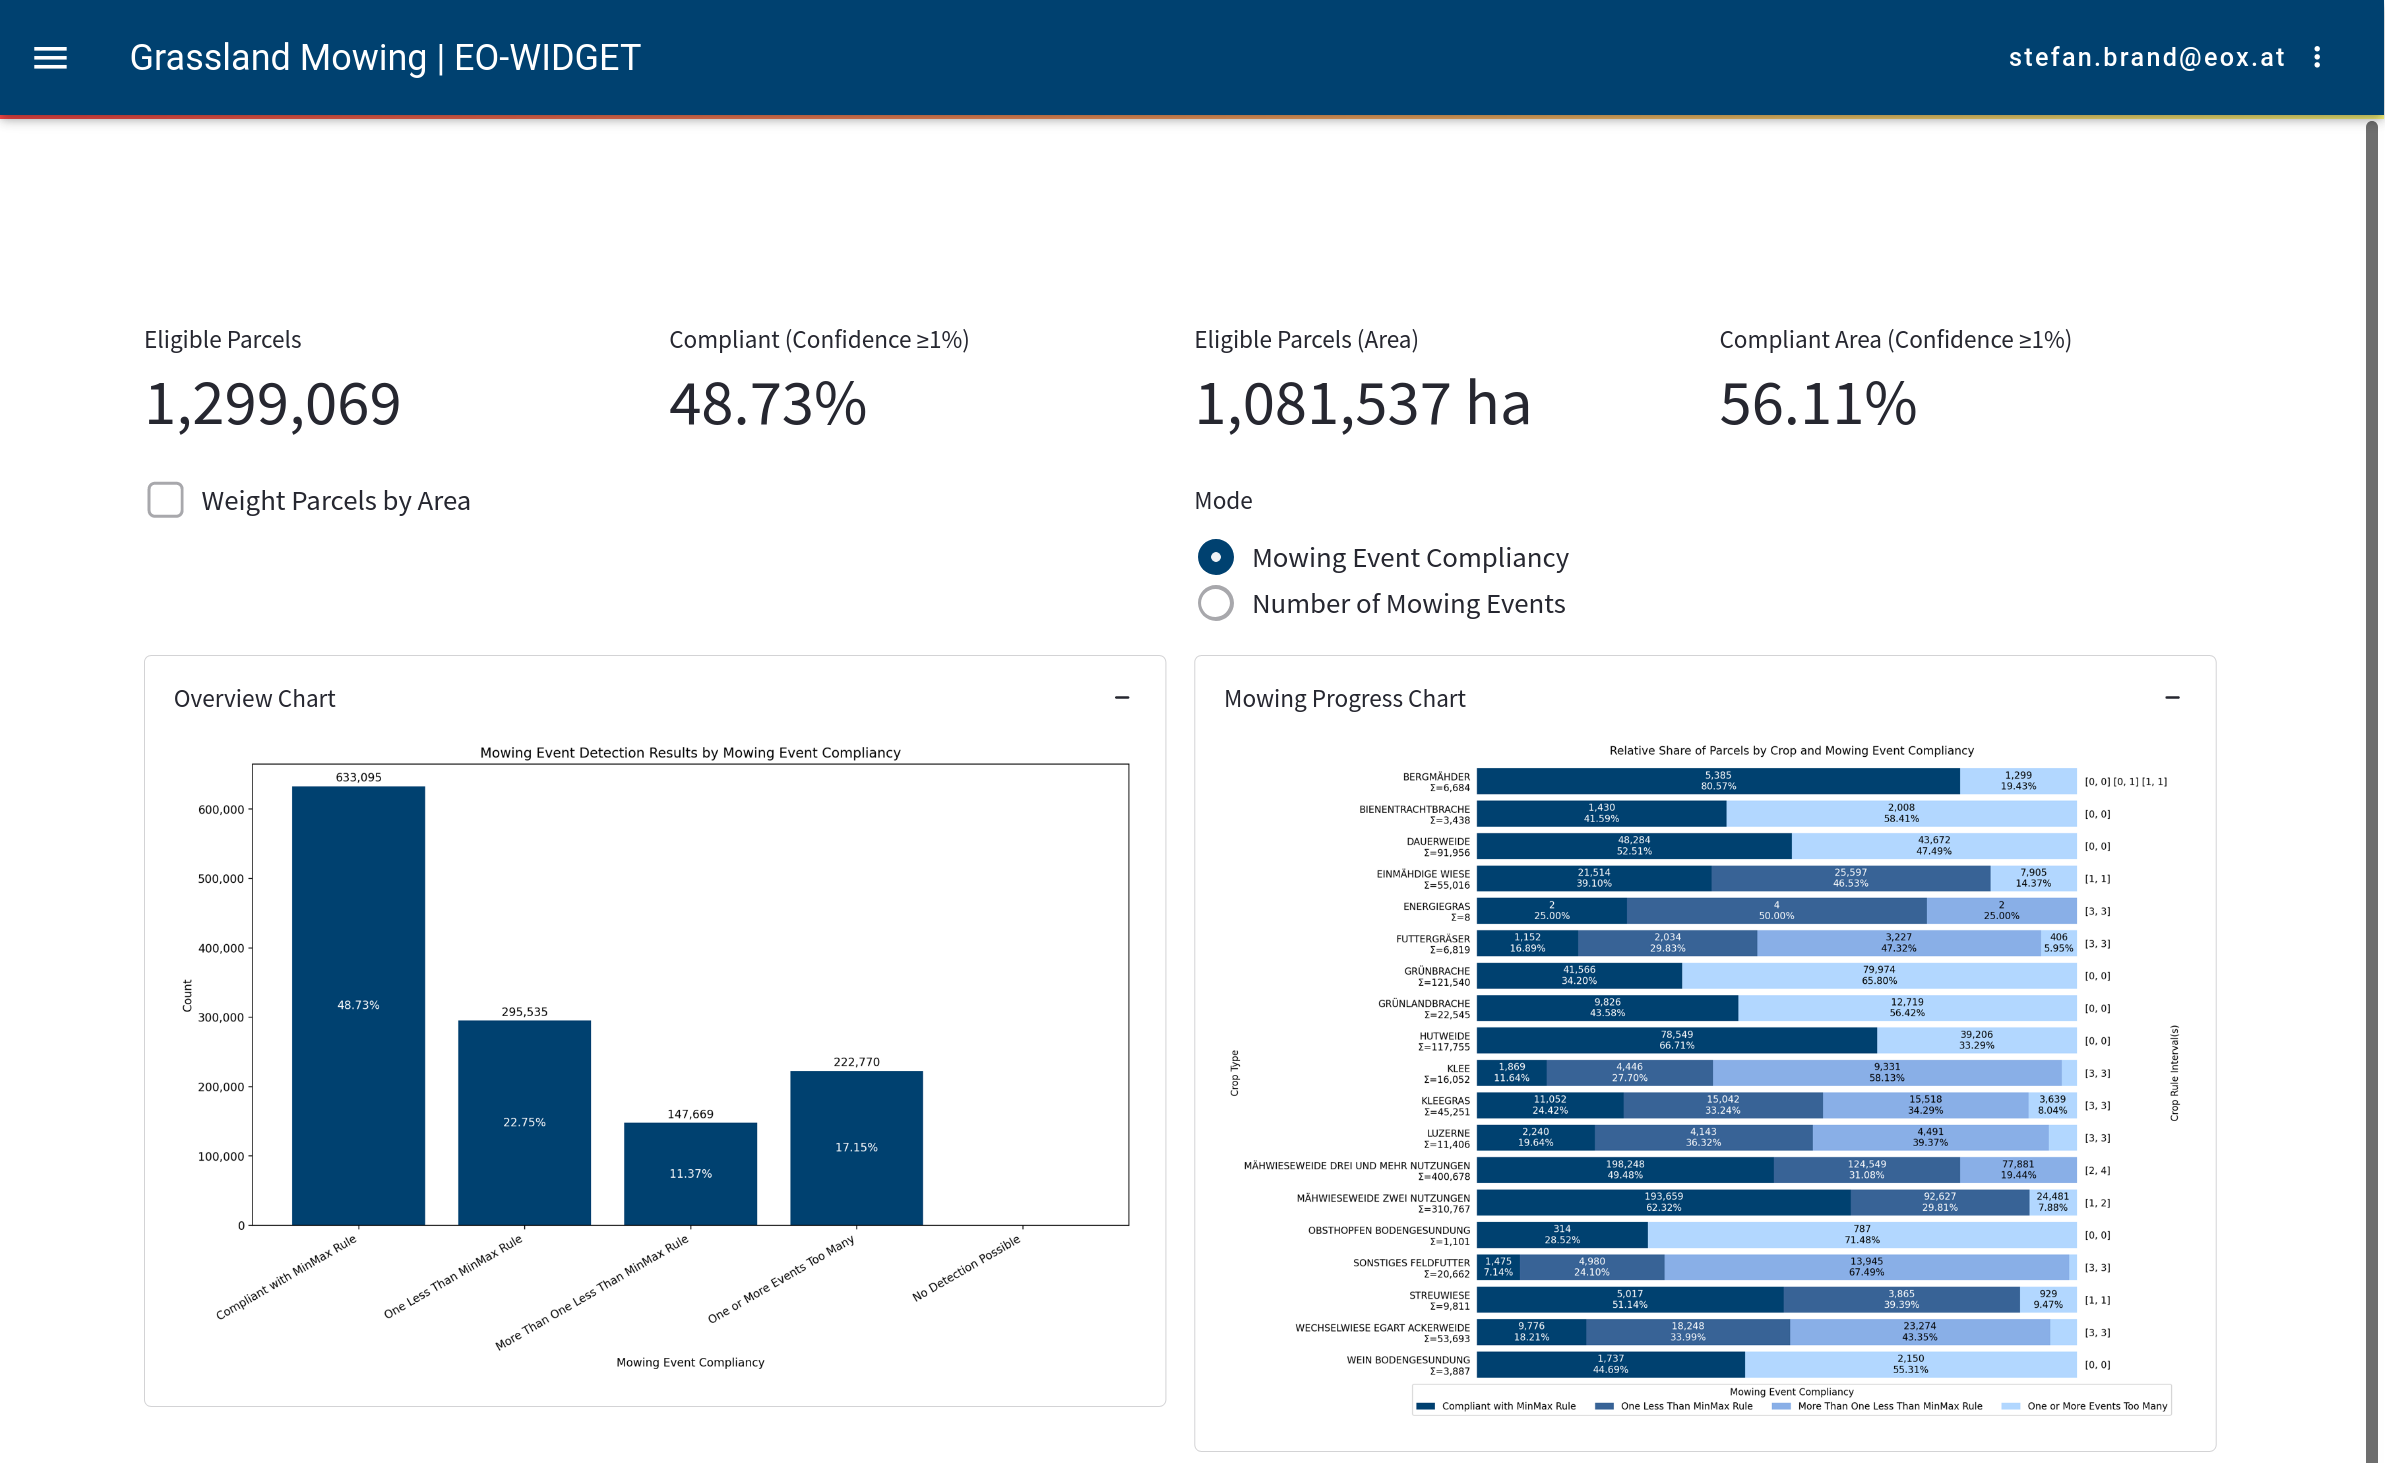
Also available is an interactive report for the grassland mowing use-case. Two charts are available, each in two different modes. The chart types are an overview bar chart and a mowing progress chart by crop type. Inside the app the user can switch between a view for the number of mowing events or a view for mowing event compliance values.
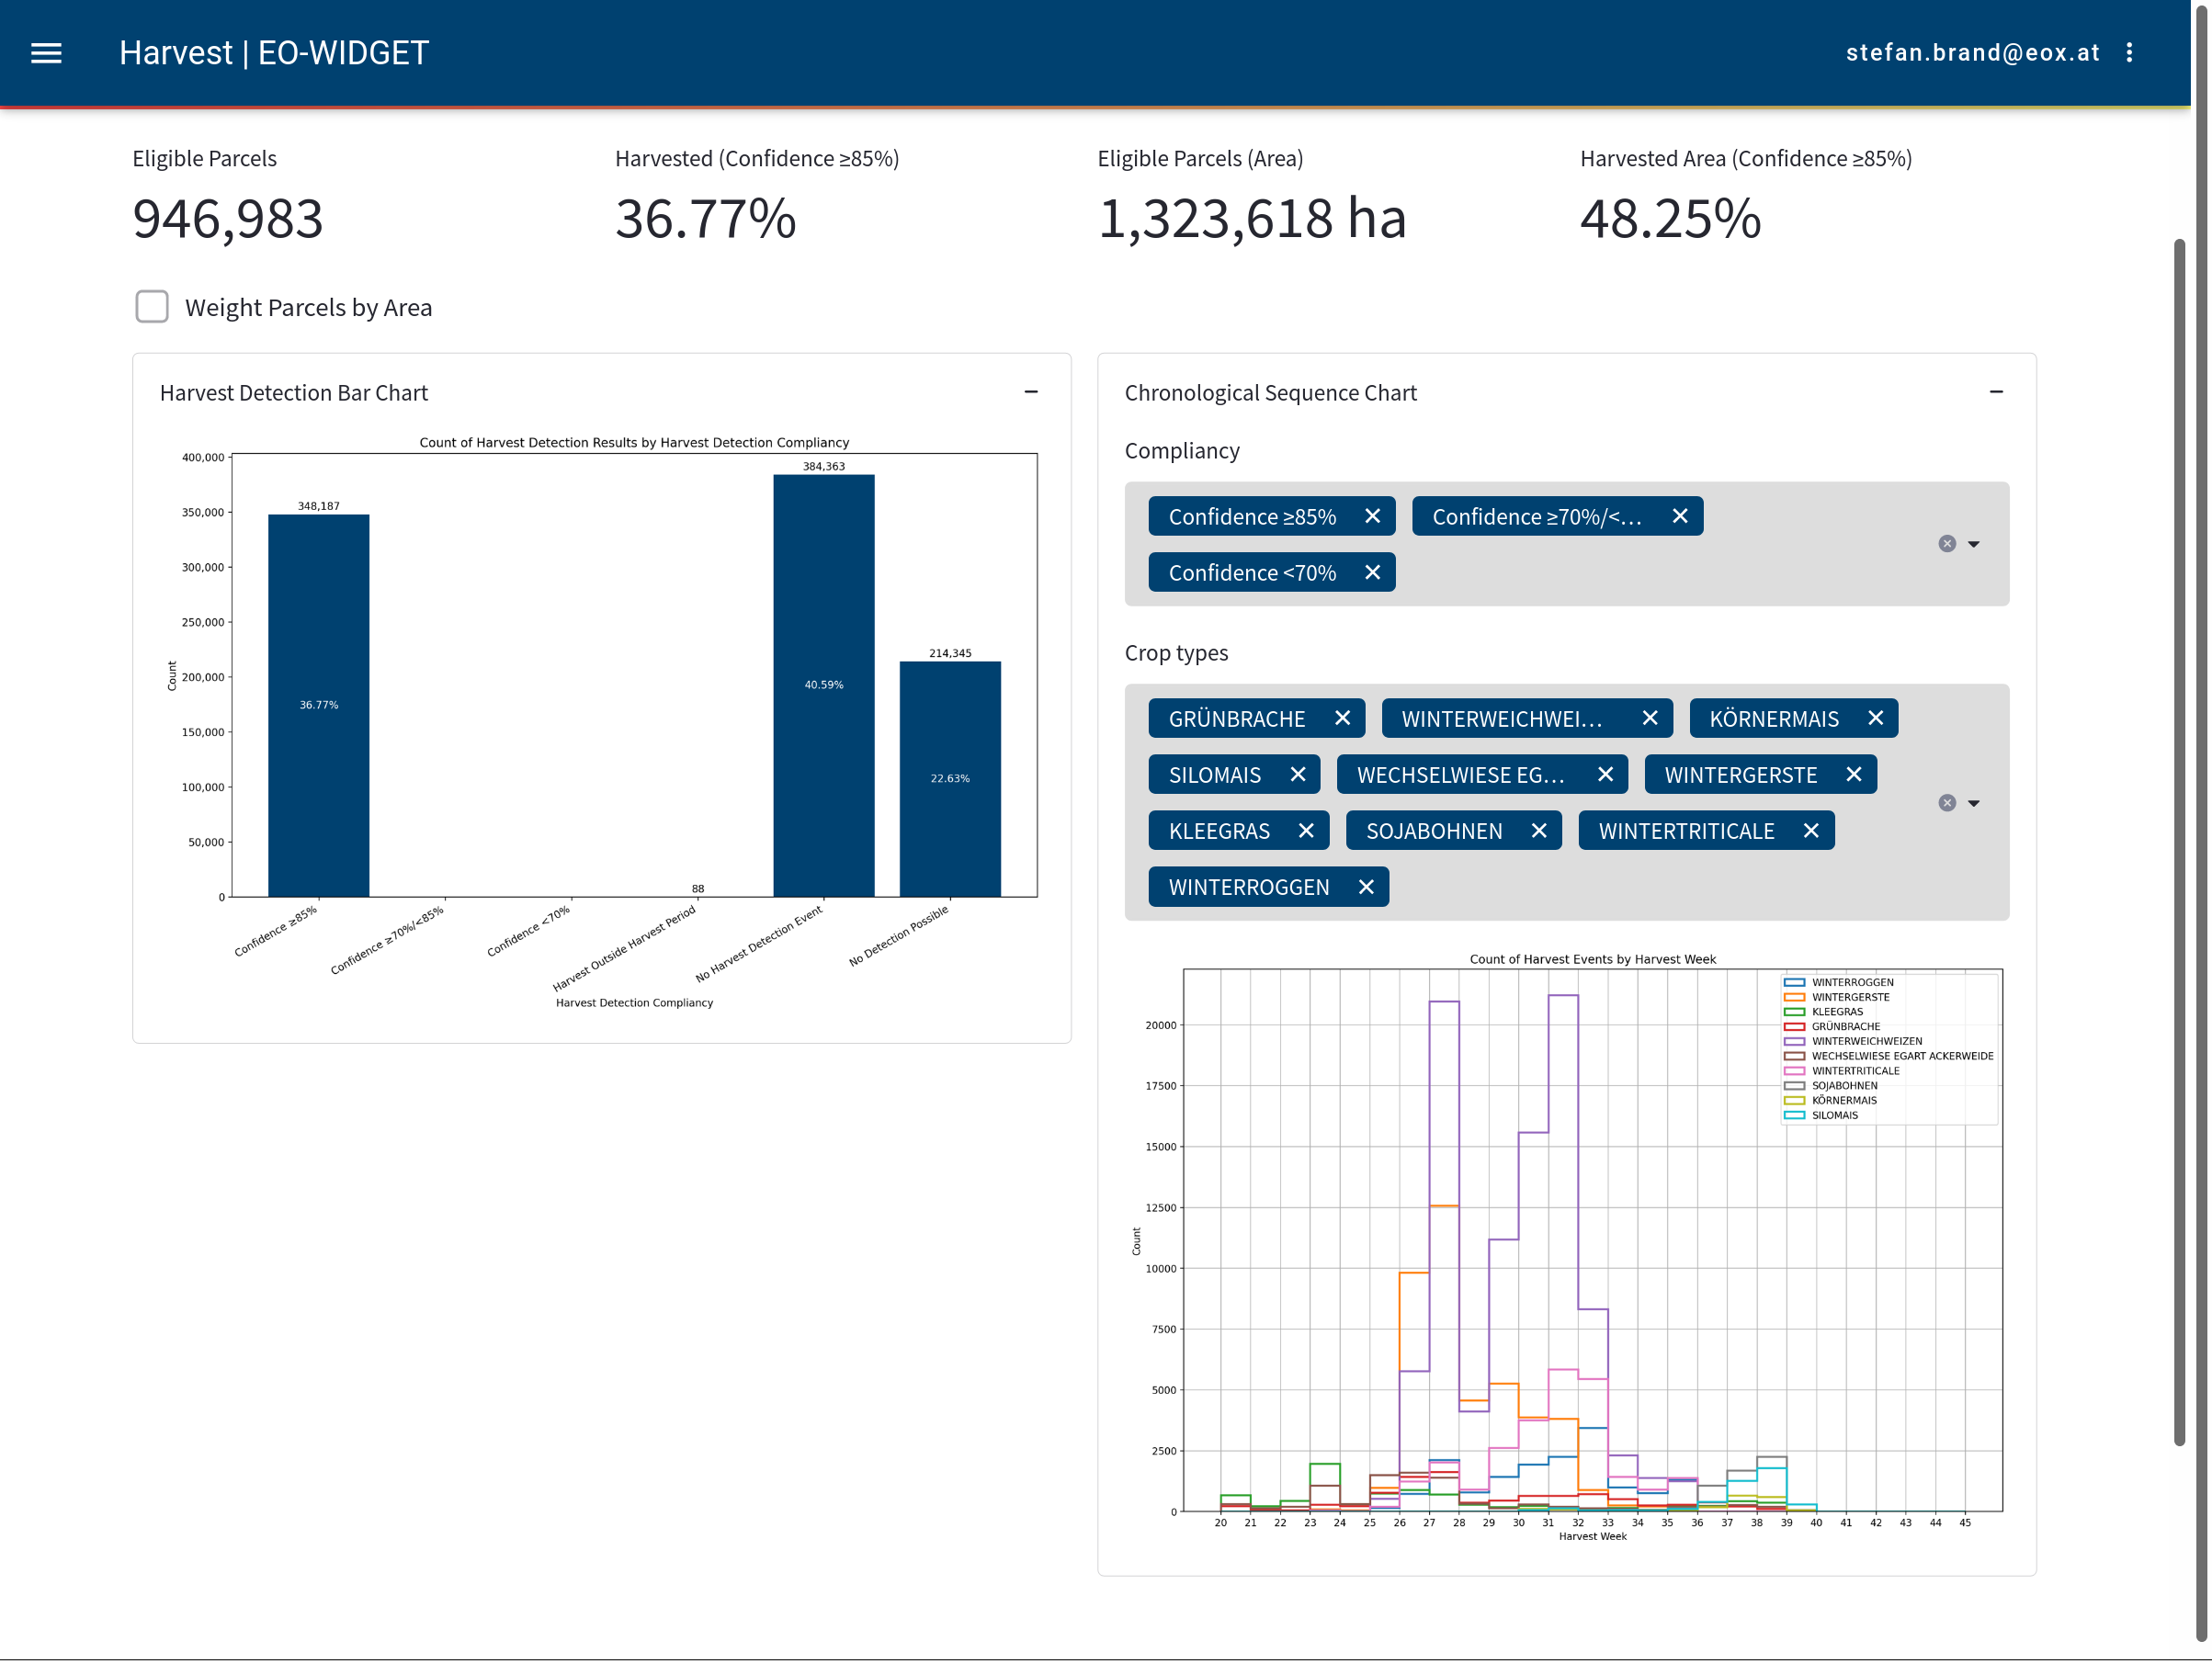
The harvest use-case also features two charts. One of them is an overview bar chart similar to the one in the grassland mowing report. The other one is a chronological sequence chart that displays the harvest events by crop type and calendar week. The harvest events can be filtered by confidence values (e.g. all harvest events with a confidence greater than 85%).
More details on the Agri Web App can be found on the EOX blogpost:
https://eox.at/2022/02/how-eo-expertise-powers-agri-monitoring-decisions-part-1/
Would you like to try the Agri Web App yourself?
Try out our EO-WIDGET Beta-App!